



ABC and XYZ Assortment Analysis: how to configure it and read the results correctly
ABC analysis distributes products by their contribution to the selected indicator: sales quantity, number of receipts, turnover, or gross profit. XYZ analysis evaluates how evenly sales occur over time. Together, they show which items affect the store’s result, how predictably they sell, and where a separate purchasing scenario is needed.
The product class depends on the selected criterion, period, interval, and sample composition. The designation C or Z by itself is not a reason to remove a product from the assortment.
What ABC analysis shows
The program sorts products by the selected indicator, calculates each item’s share in the total result, and accumulates these shares. With the standard 80–95–100 limits, products are distributed as follows:
- A — items that together form the first 80% of the selected indicator;
- B — items in the accumulated share range from 80% to 95%;
- C — items that account for the last 5%, from 95% to 100%.
The 80/20 ratio is a reference point of the Pareto principle. The actual number of products in class A depends on your data. Class A may contain 8%, 20%, or 35% of items. The 80–95–100 limits in Torgsoft can be changed according to the structure of the assortment.
Which ABC analysis criterion to choose
| Criterion | What it measures | Which decision it is useful for |
|---|---|---|
| By sales quantity | Number of sold product units | Finding products with the largest physical sales volume, planning replenishment and storage locations |
| By number of receipts | Number of receipts that included the product | Assessing how often customers choose the product and its role in forming purchases |
| By turnover | Sales amount minus returns amount | Assessing the product’s contribution to store turnover |
| By gross profit | Turnover minus cost of goods sold plus cost of returned goods | Assessing the product’s contribution to gross profit according to the program’s terminology |
An unrecalculated cost price distorts the product class. Generate the result, use the Calculate cost price action, and rebuild the analysis.
Several criteria can be enabled for one analysis. Then the product receives a separate letter for each of them. For example, class AC when analyzing by sales quantity and gross profit means a large sales volume and a small contribution to gross profit. Such a result requires checking the price, discounts, purchase cost, and the product’s role in the assortment.
What XYZ analysis shows
XYZ analysis divides the period into equal intervals and compares product sales between them. The basis of the calculation is the coefficient of variation:
Coefficient of variation = standard deviation of sales ÷ average sales per interval.
The lower the value, the more evenly the product sold. In the standard Torgsoft settings, the following limits are used:
- X — coefficient up to 0.2: sales are relatively stable;
- Y — from 0.2 to 0.6: sales fluctuate noticeably;
- Z — above 0.6: sales are irregular, and historical demand is difficult to forecast.
A value of 0.2 corresponds to 20%, and 0.6 to 60%. The coefficient may exceed 1 if a large one-time sale occurred after several intervals without sales.
The period should contain a sufficient number of intervals. For operational analysis, it is convenient to take 84 days with a 7-day interval: the program will compare 12 weeks. One calendar month with a 7-day interval gives too few observations for a reliable conclusion.
XYZ characterizes evenness over the past period. It does not establish the cause of fluctuations and does not take into account a future promotion, price change, season, supplier shortage, or prolonged absence of the product from stock. These circumstances must be checked separately.
How to configure ABC and XYZ analysis in Torgsoft
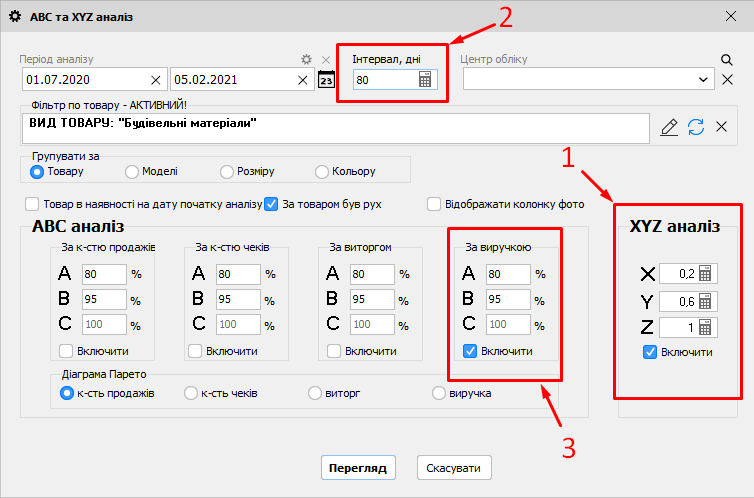
- Open Analysis → ABC and XYZ analysis.
- Specify the analysis period. For comparison, use periods of the same duration.
- For XYZ analysis, set the interval in days. Match it to the sales cycle: day, week, or a longer period.
- Select an accounting center or analyze the network as a whole. For stores with different demand, it is useful to additionally generate a separate result for each center.
- Use the filter to form a homogeneous sample: product type, manufacturer, season, collection, or another required attribute.
- Select grouping by product, model, size, or color.
- If necessary, activate the parameters Product in stock on the analysis start date, There was movement for the product, and Display photo column.
- Enable the required ABC analysis criteria and check the A, B, and C limits.
- Enable XYZ analysis and check the X, Y, and Z limits.
- Select the criterion for the Pareto chart and click Preview.

How to choose grouping
| Grouping | What appears in one row | When to use |
|---|---|---|
| Product | Separate product item | Targeted purchasing decisions for a specific SKU |
| Model | Total indicators of all sizes and colors of the model | Assessing the model as a whole in clothing, footwear, and similar assortments |
| Size | Total result by size within the sample | Forming the size range and checking demand for sizes |
| Color | Total result by color within the sample | Planning the color structure of purchasing |
When grouping by model, the quantities and amounts of all its variants are summed. Therefore, the model result naturally differs from the indicators of a separate product.
How to work with the results table
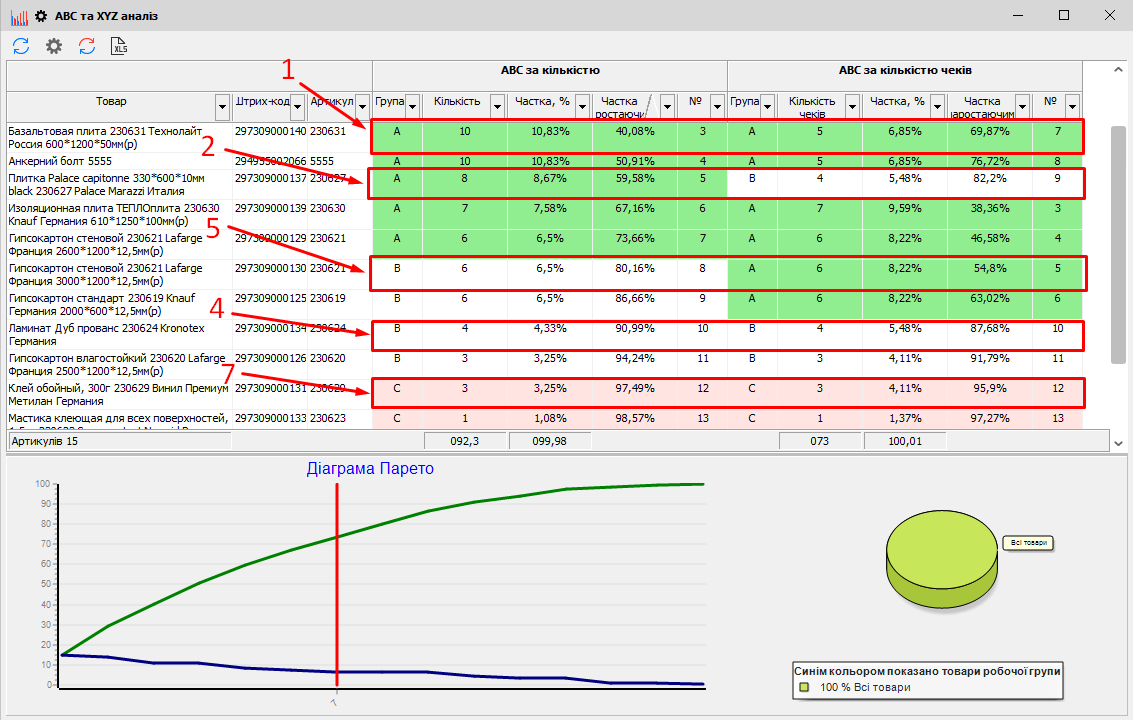
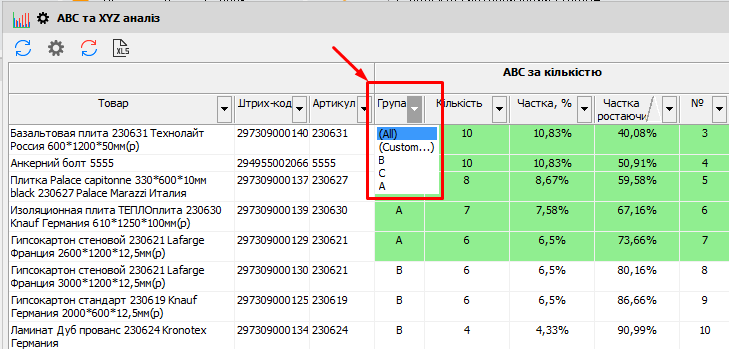
In the table, you can sort and filter products by categories, view the Pareto chart, change analysis conditions, and export the result to Excel. For a management decision, it is useful to leave only the required classes, for example AZ, BZ, and CZ, and consistently check each item.
For XYZ analysis, enable the corresponding block in the settings, set the interval, and generate the result. After that, open the ABC-XYZ matrix.

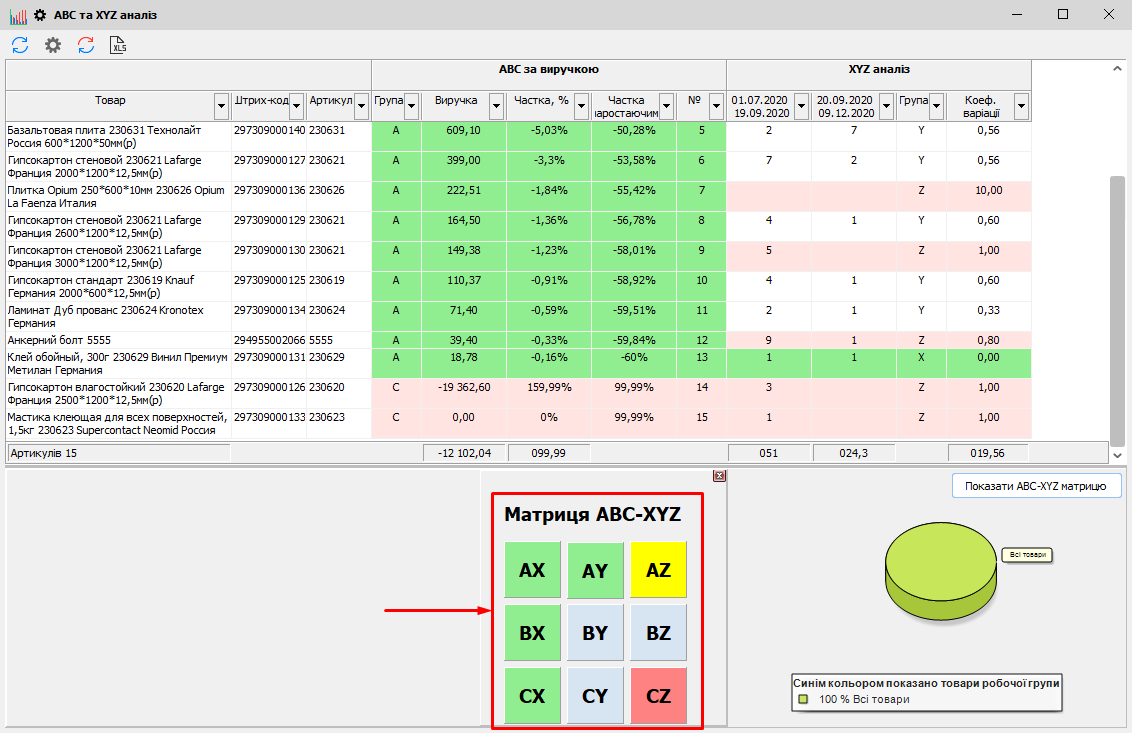
How to read the ABC-XYZ matrix
| Group | What it means | Practical action |
|---|---|---|
| AX | High contribution, even sales | Control availability, delivery times, and accuracy of replenishment parameters. With stable supply, a moderate safety stock is sufficient |
| AY | High contribution, noticeable fluctuations | Review stock balances more often, take seasonality, promotions, and the demand calendar into account |
| AZ | High contribution, irregular sales | Manage items individually, shorten delivery time, check one-time orders and reasons for spikes. Increasing stock across the board creates a risk of surplus |
| BX | Medium contribution, even sales | Apply regular replenishment and standard availability control |
| BY | Medium contribution, demand fluctuations | Review stock according to the calendar, adjust orders before the season or promotion |
| BZ | Medium contribution, irregular sales | Reduce batches, agree on more frequent deliveries, consider purchasing to order |
| CX | Low contribution, even sales | Simplify control and replenish at a constant frequency, taking shelf life and storage cost into account |
| CY | Low contribution, sales fluctuate | Check the minimum batch, role in the category, and appropriate stock level |
| CZ | Low contribution, irregular sales | Check product age, stock balance, margin, seasonality, and role in sales of other items. After checking, choose clearance sale, purchasing to order, minimum stock, or removal |

Which data can distort the result
- Too broad a sample. Comparing bread, winter footwear, and accessories in one calculation gives classes with different business meanings. Analyze comparable product groups.
- Short period. A few intervals create an unstable XYZ assessment. Increase the period or reduce the interval.
- Product absence. Zero sales during a shortage lower the ABC class and increase XYZ variability, although demand may have remained.
- Promotions and one-time wholesale purchases. They may temporarily move a product to A or Z. Check sales documents and the promotion calendar.
- Seasonality. For a seasonal group, compare the same seasons or analyze the season separately.
- New products. A short sales history does not provide a sufficient basis for an assortment decision.
- Returns and cost price. They affect turnover and gross profit. Recalculate cost price and check atypical returns.
- Changing the grouping method. Product, model, size, and color answer different questions. Compare results with the same grouping.
How to turn analysis into a decision
- Formulate one task: reduce shortages, reduce surplus, check margin, or prepare purchasing.
- Select a homogeneous product group and a sufficient period.
- Build ABC by two relevant criteria, for example by sales quantity and gross profit.
- Add XYZ and highlight groups that require attention: AZ, BZ, CZ, as well as AC by profitability.
- For each item, check stock balance, days of absence, last receipt, supplier, delivery time, minimum batch, promotions, returns, and seasonality.
- Record a specific action: change the batch, order frequency, price, supplier, sales method, or product status.
- Repeat the analysis after a full replenishment cycle and compare the result with the previous period.
Previous program builds fixed errors in grouping by model and calculating quantity with the availability parameter at the start of the period. If the result looks illogical, update the program, repeat the calculation on the same sample, and send the analysis parameters to technical support.
Frequently asked questions
Why did an expensive product fall into category C
The unit price does not determine the class. The category depends on the product’s contribution to the selected criterion over the entire period. An expensive product with two sales may be C by quantity and A by gross profit.
Why did a popular product receive a low class by gross profit
The product may sell often with a low margin, a large discount, or a high cost price. Check the purchase price, cost price calculation, returns, and promotions.
Why did the product fall into Z
Sales differed significantly between intervals. The reason may be seasonality, shortage, promotion, a large one-time purchase, or an unsuitable interval. Check the product movement history.
Which period to use for XYZ analysis
The period should cover at least 8–12 intervals and correspond to the demand cycle. For a weekly interval, the practical minimum is about 2–3 months. Analyze seasonal products within the season or compare them with the same season of the previous year.
Should all CZ products be removed
Automatic removal creates the risk of losing new, seasonal, image-building, complementary, and made-to-order items. First check the product’s role, stock balance, margin, connection with other sales, and the reason for irregular demand.
Why are model indicators higher than indicators of a separate product
Grouping by model sums the sales of all its colors and sizes. For a decision about a specific SKU, switch grouping to product.
 Go back to the previous step