


If your store’s sales have declined, first identify what changed: the number of purchases, units sold, average transaction value, returns, or profit per item. Compare the same days of the week, stores, and categories, taking opening hours and product availability into account. This will help you choose an action that addresses the problem you find.
We recommend that store owners in Ukraine review their data over seven days, then test one change for 14 days with a limited group of products or at a single location. This is a suggested working schedule: if there are few purchases or the buying cycle is long, you will need more observations to draw a conclusion. Before the test, assign someone to be responsible and define the budget, success metric, and conditions for stopping.

Identify which metric has declined
For this review, use revenue after returns: the value of completed sales at actual prices, after discounts, minus the value of goods whose returns were recorded during the selected period. Count returns at the prices of the corresponding sales, regardless of when the store paid the customers. Record the actual payouts separately as cash flow. Keep both components in the data. A return from a purchase made last week can reduce today’s revenue even if the store sold the same amount of goods today.
- Number of receipts shows how many sales were completed. Do not include canceled documents or return receipts in the purchase count.
- Number of orders in an online store should be counted by status: received, confirmed, fulfilled, or canceled. An order submitted on the website does not yet mean a completed sale. Set a rule for when an order is included in the report and apply it to both periods. To compare the share of fulfilled orders, group them separately by the date the order was received and allow each group the same amount of time to be fulfilled. Divide the number of fulfilled orders in each group by all orders received in that group, then multiply by 100%. Do not divide orders fulfilled during the week by orders received during that same week if the fulfilled orders include orders from earlier periods.
- Units sold shows the physical volume of sales. Count returned units separately, then calculate units after returns. Do not combine pieces, kilograms, and meters into one metric.
- Average transaction value is calculated as the value of completed sales after discounts but before returns, divided by the number of sales receipts. Analyze returns alongside it so they do not obscure changes in purchase size.
- Store traffic is the number of visits to a store. For a website, choose one metric, such as sessions, and do not mix it with the number of users.
- Conversion rate shows what share of visits resulted in a purchase. For a physical store, divide the number of visits that included a purchase by all recorded visits, then multiply by 100%. If you use receipts instead of visits with purchases, remember that one shopper may receive several receipts.
- Gross profit for management comparisons is revenue after returns minus the cost of goods sold plus the cost of returned goods. Before calculating it, agree with your accountant on which taxes are included in these amounts, including how value-added tax (VAT) is treated. If the cost of goods sold excludes VAT that the store can claim as input tax credit, use revenue excluding VAT for this comparison too. To calculate gross margin as a percentage, divide gross profit by revenue after returns and multiply by 100%. Revenue must be positive for this comparison. If it is zero or negative, analyze sales, returns, and cost of goods separately. Gross profit does not yet account for all store expenses: to assess the overall financial result, separately include rent, payroll, and other expenses that are not included in the cost of goods.
- Cash balance and cash flow should be checked separately: how much money came in, how much was paid out, and how much remains. Purchases, debt repayments, and payment due dates affect cash, so profit from goods is not the same as the amount available for payments.
How average transaction value can rise while revenue falls
Illustrative example, with no returns. In the first comparable week, the store had 100 receipts with an average transaction value of UAH 500: 100 × 500 = UAH 50,000 in revenue. In the second week, it had 80 receipts with an average transaction value of UAH 550: 80 × 550 = UAH 44,000.
Average transaction value rose by 10%: (550 − 500) ÷ 500 × 100%. The number of receipts fell by 20%, and revenue fell by 12%: (44,000 − 50,000) ÷ 50,000 × 100%. The store owner should investigate why there were fewer purchases. The increase in average transaction value alone does not explain it. If there were returns, subtract the corresponding return amount from each sales amount as well.
Prepare comparable data
Create a table with one row for each day at a specific store. Record actual opening hours, sales after discounts, returns, the number of receipts and units, cost of goods, visits, and any circumstances that may have affected the result. For an online store, add order statuses and response times to customer inquiries.
- Compare the same set of days. Use complete weeks from Monday to Sunday. Mark holidays, promotions, and unusual orders. If needed, add several earlier comparable weeks to see whether the decline is recurring.
- Use the same set of store locations. First compare stores that were open in both periods. Show the contribution of locations that opened or closed separately.
- Account for opening hours. Alongside total figures, calculate revenue and receipts per trading day and per hour. Also compare the same hours: an hourly average alone cannot fully account for the effect of shorter evening opening hours.
- Check categories and specific products. A change in the share of expensive and inexpensive goods affects average transaction value. Compare the same SKUs, actual prices, units per receipt, and gross margin by category.
- Mark product availability. Record how long the required product, size, or color was unavailable for sale. Check both the stockroom and the sales floor. A day with a full assortment and a day without popular items need different explanations.
Check seasonality using your own history for the relevant categories: compare similar points in the season, availability, and trading conditions. If there is not enough history, treat seasonality as a working assumption. A simultaneous decline in sales and change in weather, advertising, or opening hours does not prove a causal link.
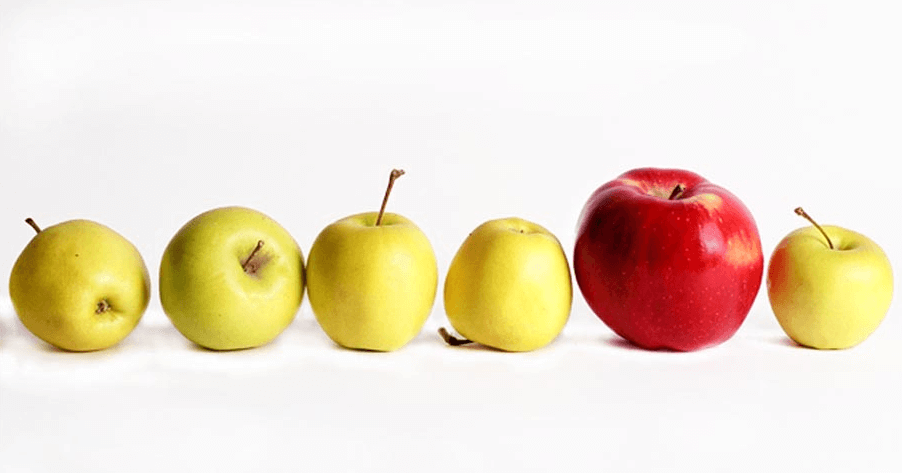
Illustration of differences between products.
Match the symptom to a check and a small action
The table lists possible explanations and suggested checks. Choose a row based on your store’s actual data; each explanation needs confirmation.
| Symptom | What data to check | Possible causes | Small action | What to measure |
|---|---|---|---|---|
| Fewer receipts and visits | Traffic during the same hours, actual opening schedule, access to the entrance, accuracy of the address and opening hours | The store was open for fewer hours; customers have more difficulty finding it or getting inside; demand has changed | Correct an identified error in the store information or directions to the entrance | Visits and receipts during comparable hours |
| Traffic is steady, but there are fewer purchases | Visits that included a purchase, queues, inquiries that did not result in a purchase, availability of requested items | Customers cannot find the product; they wait too long; they do not get the explanation they need | Check one possible cause, such as adjusting staff assignments during busy hours | Conversion rate, waiting time, gross profit during comparable hours |
| The number of receipts is unchanged, but average transaction value is lower | Units per receipt, prices of the same products, discounts, category shares | Customers buy fewer units; they choose less expensive goods; a larger share of sales is discounted | For one category, suggest a relevant complementary product and explain its benefit | Units per receipt, average transaction value, gross profit per receipt |
| A category is selling less, and requested items are unavailable | Stockout dates, stock levels by size, and the timing of orders and delivery receipts | Late ordering; supplier delays; goods are in the stockroom but not on display | Restock the shelves or make a limited replenishment of verified items | Time out of stock, unmet requests, sales after replenishment |
| Revenue is steady, but gross profit has declined | Actual prices, discounts, unit cost, mix of products sold | Cost of goods has risen; discounts are used more often; a larger share of sales comes from lower-margin goods | Check the setup of one promotion and the economics of the products included | Gross profit amount, gross margin, units sold |
| Sales before returns are steady, but revenue after returns is lower | Return amounts and reasons, products, batches, and original sales | A problem with a specific product; an inaccurate description; a selection error; returns of large purchases made earlier | Check products with recurring return reasons and improve the description or customer advice | Number and value of returns by reason, revenue after returns |
| The number of online orders is unchanged, but fewer are fulfilled | Statuses, response times, cancellation reasons, whether stated availability matches actual stock | Slow confirmation; product unavailable; customer does not agree to the delivery or collection terms | Assign someone to confirm orders and check stock during selected hours | Share of fulfilled orders, response time, cancellations by reason |
| Product performance is acceptable, but there is not enough cash for payments | Receipts and payments, purchases, customer debts, payment due dates for suppliers | Cash has been spent on inventory; payments are arriving later; large payments are coming due | Prepare a calendar of receipts and payments, and review one nonessential purchase | Cash balance on payment due dates, overdue payments |
Record unmet requests and check supplier lead times
We recommend that sales staff record specific inquiries that did not result in a purchase because an item was unavailable. This log will help distinguish a lack of demand from situations where a customer wanted to buy an item but the store could not offer it. A recorded inquiry does not guarantee a future purchase, so track its estimated value separately from actual revenue.
| Log field | What the employee records | How the owner uses the entry |
|---|---|---|
| Date, time, location | When and where the customer made the inquiry | Compares inquiries with opening hours and availability |
| Requested product | SKU, size, color, quantity | Identifies the specific item to check |
| What prevented the purchase | Not physically in stock; not found on the shelf; price was unsuitable; another reason given by the customer | Distinguishes a stock shortage from other reasons for not buying |
| Outcome of the inquiry | Bought an alternative; agreed to wait; left without buying | Does not count a purchased alternative as a fully lost sale |
| Period out of stock | When the item ran out and when it became available for sale again | Assesses sales in light of the time the item was available |
| Supplier order | Order date, promised date, actual receipt date, and date the goods were ready for sale | Checks the real replenishment lead time, including receiving and shelf placement |
| Next action | What needs to be done, who is responsible, and the deadline | Tracks replenishment, transfers, or inventory record corrections |
Every day, compare recurring requests with physical stock. If an item is listed in the system but cannot be found, check receiving, transfers, sales, and returns. For items that are genuinely unavailable, review several recent deliveries: the promised lead time may differ from the actual one.
For trial replenishment planning, you can use the average daily sales on comparable days when the item was available, multiplied by the expected number of trading days until the next delivery is ready. Separately set a buffer for delays and account for saleable stock on hand and confirmed deliveries. This is a guide for review: seasonality, price changes, and irregular large purchases can change demand.

Example of a product set presentation; the price shown is not a current offer.
Check discount economics before launching a promotion
An increase in average transaction value may be explained by a larger share of expensive items, while a drop in margin may reflect a change in the sales mix. So first compare the price and cost of the same items, then assess separately how category shares have changed. If a popular inexpensive item is unavailable, average transaction value may rise while the number of purchases falls.
Illustrative discount example. An item sells for UAH 500 and costs UAH 350. Gross profit per unit is UAH 150. A 10% discount reduces the price to UAH 450 and gross profit to UAH 100. This cuts profit per unit by UAH 50, or 33.3% after rounding.
With unchanged costs and no returns, 100 units at the original price will generate UAH 15,000 in gross profit. To earn the same amount after the discount, you would need to sell 150 units: 150 × 100 = UAH 15,000, or 50% more. This calculation excludes additional promotion costs and does not predict demand. Before testing, work out whether stock, budget, and expected purchase volume allow you to test this offer.
Run a seven-day audit
The schedule below is a practical suggestion for store owners. During the review, record changes to prices, advertising, assortment, and opening hours so you can account for them in your conclusions.
- Day 1: check the records. Reconcile the selected sales and returns with the documents, and check cost of goods and order statuses. Record the formulas for the metrics you will use.
- Day 2: prepare the comparison. Gather comparable weeks for the same locations. Mark trading days, opening hours, promotions, and unusual events.
- Day 3: find the biggest contributor to the decline. Calculate the difference in revenue after returns in hryvnias by location and category. Where the amount declined most, check the number of receipts, average transaction value, and units sold.
- Day 4: check availability. Physically count key items in the selected category, inspect the displays, check delivery times, and review the unmet request log.
- Day 5: observe the buying process. During the same time slots, count visits and purchases, and measure waiting times. For online sales, check the process from inquiry to order fulfillment and the reasons for refusals.
- Day 6: check profit and cash. Assess actual discounts, costs, and gross profit for the selected items. Separately prepare a calendar of upcoming payments.
- Day 7: choose one check. Write down the assumption, observations that support it, and the action. For example: “Customers ask for specific sizes that are unavailable; we will replenish only those items and check the result.”
Plan a 14-day test and set conditions for stopping
Before the test, fill out a short plan. Give it to the employee responsible for carrying it out so everyone involved understands the terms in the same way.
- Assumption and action: which cause you are checking and exactly what you will change.
- Scope: one location, category, product group, or specified hours; start and end dates.
- Person responsible: who will carry out the action, check the data daily, and report any deviations.
- Primary metric: for example, category gross profit during comparable trading hours.
- Additional metrics: receipts, units, returns, time out of stock, and test costs.
- Comparison baseline: a comparable previous period; where possible, a similar location or product group without a change.
- Spending and stopping limits: the maximum purchase or promotion spend, minimum acceptable profit per unit, and any unacceptable deterioration in returns or service.
During the test, check every day that the terms are being followed and the records are accurate. If spending exceeds the set limit, gross profit per unit falls below the agreed minimum, or stock records turn out to be inaccurate, pause the test and investigate the cause. At the end, compare the result with the baseline, taking opening hours, traffic, availability, and external circumstances into account.
Improvement after a change supports the assumption, but by itself does not prove that the action alone caused the result. If there is little data or conditions differed significantly, do not immediately apply the change throughout the store. Set a new observation period and budget, or test another explanation.

How to check falling sales in Torgsoft
In Torgsoft, the “Sales Intensity Analysis” report lets you select a period, accounting center, and products; filter by days of the week; and view product quantities, receipts, or product amounts grouped by hours, days, or weeks. Use it to find the hours and categories where sales have changed. Average values are available only when grouping by hour, day of the week, month, or quarter. Before using the “Product Amount” metric as revenue after returns, reconcile it with sales and return documents for the same period. To assess conversion, collect visit data separately; to check advertising, use data on inquiry sources.
In the “Profitability of Sales for a Period” report, check units sold minus returned units, sales minus returns, cost of goods, and the distribution of sales and profit by discount percentage. Before comparing results, select the same value in the “Cost Source” field. In “Warehouse Documents” mode, the program takes cost only from documents; in “Warehouse State on Document Date” mode, it takes cost only from the warehouse state on the corresponding date.
In combined mode, the program uses the cost recorded in the document, or, if it is missing there, the warehouse state on the document date. Check items without recorded costs, since the source selected affects the calculated result. Check unit costs and the returns recorded in the system. Read the column formulas: in this report, “Sales Proceeds” means the difference between the value of sales and the cost of goods sold, while “Profit” takes the cost of goods received into account, so unsold goods also affect it.
Compare these metrics separately with expenses and cash movements.
Before deciding to replenish stock, reconcile recorded quantities with the physical stock. The “Warehouse State” screen lets you view quantities, sizes, prices, costs, and product movements, and set a minimum stock level to identify products that are running low. If you work with multiple locations, take into account the license restrictions: “Start” includes one accounting center and does not support supplier orders or transfers between warehouses; these features are included in “Ultra” and the terminal version. Simultaneous online work by remote locations with a shared server database is available in the terminal version.


 Go back to the previous step