


To build a sales funnel for a small store, define five observable stages: visit, inquiry, confirmed order, payment and receipt of goods, and purchase after returns are accounted for. For each stage, record whom or what you count, which action confirms the transition, and where the employee gets the data. Then follow one group of shoppers through completed orders to see where people stop buying and what costs the store incurs.
You can start with a basic spreadsheet, an inquiry log, and sales records. The owner needs to compare the number of shoppers with actual payments, returns, and expenses: an increase in orders alone does not show whether the store has more money left over. Below is a practical record-keeping approach for Ukrainian retail.
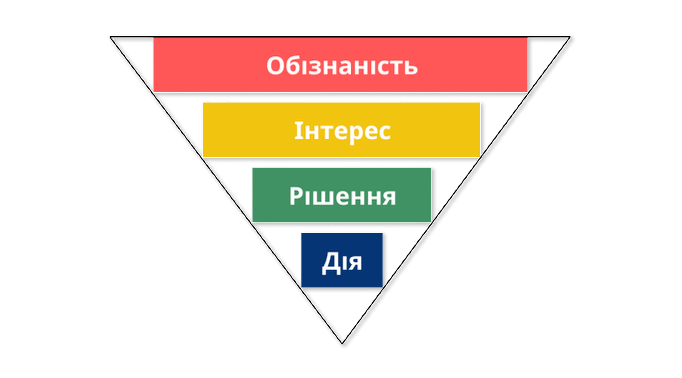
Define stages by shopper actions
A sales funnel shows how many members of a defined group complete the required actions in sequence. To make the report useful for managing the store, replace vague assessments such as “interested” with verifiable signs. For example, a salesperson can record a question about a specific size, but cannot reliably determine the intent of every person who looks at the storefront.
- Visit. For a website, define whether you count users, sessions, or views of a specific category. For a physical store, you can count entries using set rules, excluding employees and service visits separately. Do not call the number of entries the number of unique people if you cannot distinguish repeat visits.
- Inquiry. Count a specific question about a product, its availability, selection, or how to make a purchase. Keep repeat messages within one inquiry in the same record, and count the number of messages separately if needed.
- Confirmed order. An employee has checked availability, and the shopper has agreed to the items, total, and fulfillment method. Clicking the checkout button alone is not enough for this status.
- Paid and received. There is confirmation of full payment and actual receipt of the goods. Keep prepayment without dispatch or handover in a separate interim status.
- Purchase after returns. As of a set review date, the order has not been returned in full. Mark partial returns separately and reduce the relevant monetary figures.
This is a recommended model for a process in which shoppers contact a salesperson before ordering. If a website allows customers to buy without a consultation, create a separate sequence for self-service purchases: visit → checkout → confirmation → payment and receipt → outcome after returns. Otherwise, shoppers who successfully order without asking questions will mistakenly appear to have stopped buying.
Keep people, orders, and events separate
One person may visit a website three times, send five messages, and place two orders. In that case, the store has one person, three visits, five messaging events, and two orders. Dividing orders by people gives you “orders per person,” not the share of people who bought.
For a person-based funnel, count each participant once at each stage. To track order fulfillment, keep a separate table with one row per order number. Linking the tables lets you see both the share of shoppers who bought and repeat purchases without mixing these measures.
The recommended minimum fields are: internal participant code, date of first entry into the group, acquisition channel, inquiry date, order number, confirmation, payment, and receipt dates, amount paid, amount refunded, and reason for not completing the purchase. Store contact details separately from the working report if a code is enough for analysis. If there is no reliable way to link a visitor to a buyer, show two separate reports and do not claim to have tracked one person’s entire journey.
Select a group by the date of its first visit or inquiry, and give it time to complete purchases. For example, you can add a new group every week and review its results after the same chosen interval. This review date is the store’s analytics rule; it does not determine the legal time limits or the shopper’s rights to return goods. Account for later returns in subsequent updates.
Calculate stage transitions and overall conversion
Illustrative example, not a market benchmark. A store tracked 1,000 individual visitors from one channel where orders are placed after an inquiry. In this example, each person has no more than one order, all later stages belong to the same group, and there are no partial returns. By the review date, all orders have a known outcome.
| Stage | Number of people | Transition from previous stage | Share of the initial 1,000 |
|---|---|---|---|
| Visited the store or website | 1000 | — | 100% |
| Inquired about a purchase | 150 | 150 ÷ 1000 × 100% = 15% | 15% |
| Confirmed an order | 60 | 60 ÷ 150 × 100% = 40% | 6% |
| Paid for and received the goods | 48 | 48 ÷ 60 × 100% = 80% | 4.8% |
| Kept the purchase after returns were accounted for | 44 | 44 ÷ 48 × 100% ≈ 91.67% | 4.4% |
Transition conversion = number of people at the next stage ÷ number of people at the previous stage × 100%. Overall conversion to a purchase after returns is 44 ÷ 1000 × 100% = 4.4%. The 91.67% figure describes only the last transition among those who had already paid for and received the goods.
In a real store, a shopper may keep part of an order. In that case, they remain among shoppers with a partial return, but their original purchase amount no longer works for calculating the financial result. Add the number and amounts of full and partial returns to the report so a high conversion rate does not hide a drop in revenue.
Set up separate data collection for the website and sales floor
On the website, check what each event means
In Google Analytics 4 (GA4), Google’s web analytics system, funnel exploration lets you set a sequence of steps, transition conditions, and time limits between steps. According to Google’s official help documentation, users enter a closed funnel through the first step and an open funnel through any step. A user is counted only at the steps they complete in the specified sequence; during the exploration period, the report counts only the first such sequence for that user.
For analysis of the path from a specific initial visit, it is recommended that you create a closed funnel and verify it with a test run. If other actions may occur between viewing a product and checkout, choose an indirect transition condition that allows them. Also record the time limit for transitions: changing this setting changes which people make it into the later steps.
Ask the person responsible for the website to check exactly when the purchase event is sent. If it fires as soon as an order is placed, its count confirms neither payment nor receipt of goods. If returns are not sent or accounted for in the report, the displayed amount does not prove revenue after returns either. For management reporting, reconcile orders by order number against payments, receipt, and returns in the store’s records.
Before starting comparisons, check several real scenarios: a successful purchase, an unpaid order, reopening the order completion page, and a return. Find out whether extra events are being recorded and whether the order number is retained. Treat discrepancies between web analytics and store records first as questions about setup and data completeness.
Start with a simple log on the sales floor
A recommended method for a small store is to use a separate entry counter and a short log of product-related inquiries. At the start of a shift, salespeople agree on what counts as an inquiry and how to count a group of people who enter together. At the end of the shift, the employee in charge reconciles recorded inquiries with related sales and notes reasons for not completing a purchase if the shopper shared them.
An anonymous entry count cannot reliably distinguish a repeat visit by the same person. So state the measure plainly in this report—for example, “receipts per 100 entries.” You can keep a separate funnel from inquiries to completed purchases using internal inquiry codes, but do not require a phone number from every visitor just to make the analytics more complete.
Find the drop-off that matters most to the store
In the illustrative example, 850 people did not move on from the visit to inquiry stage, 90 from inquiry to confirmation, and 12 from confirmation to payment and receipt. Four more fully returned their purchases. The largest number of people stopped at the first transition, but these figures alone are not enough to identify the most profitable change.
To choose an action, consider three things together: how many people did not move on, what costs the store has already incurred, and what specific obstacle can be tested. Review the 12 orders that did not reach “Paid and received” separately: find out which were unpaid, which were canceled before dispatch, and which were not received, then identify the store’s actual costs in each case. At the same time, some visitors may only have been browsing the selection, so their absence from the next stage should not automatically be treated as a salesperson’s mistake.
- Few inquiries. Check whether the product page matches the ad, and whether availability, price, features, and a way to ask a question are visible. Compare results by device and product category.
- Many inquiries, few confirmations. Record the time of the first response and known reasons for declining: size unavailable, price unsuitable, or the shopper did not agree to delivery. Mark a reason the shopper did not give as unknown.
- Orders are confirmed but not paid for or received. Check unpaid orders, cancellations before dispatch, and refusals on receipt separately. These cases call for different changes to the process.
- Purchases are returned. Compare the reasons with specific products, descriptions, and salesperson recommendations. Frequent issues with size are worth checking against measurement accuracy and advice.
Do not assign reasons based only on behavior in analytics. Leaving the payment page does not by itself prove that the shopper disliked its form. To verify, use a reproduced technical error, an actual message from the shopper, or the results of a separate experiment.
Assess how sales contribute to covering costs
For management comparisons, it is recommended that you calculate a channel’s contribution after variable costs. Take the amount paid for goods after discounts and refunds to shoppers, then subtract the cost of goods retained, payment and order fulfillment costs, losses from returns, and acquisition costs. Use the same tax basis throughout and do not subtract an expense twice.
Illustrative financial example. After refunds, payments retained for goods totaled UAH 44,000, and the cost of the goods kept by customers was UAH 26,000. Packaging, handling, delivery paid by the store, and fees cost UAH 3,000; additional return-related losses were UAH 1,000; and advertising cost UAH 4,000. Contribution is UAH 44,000 − UAH 26,000 − UAH 3,000 − UAH 1,000 − UAH 4,000 = UAH 10,000.
In this example, UAH 1,000 means additional return-related expenses or losses; it is not a second deduction of money already refunded to shoppers. Rent, fixed salaries, and other expenses still need to be covered from the contribution, so it is not the same as net profit. If the store incurs costs to fulfill canceled orders, include them in the calculation too.
Compare channels using the same rules
Before comparing advertising, search, social media, and the physical store, define how a purchase is assigned to a channel. For example, in an internal report, you can assign a shopper to the channel of their first recorded inquiry within the selected group, while keeping later contacts separately. This rule for assigning results to channels is called attribution; apply it consistently to all groups being compared.
- Remove duplicates. If a person contacted you on social media and by phone, link both inquiries to one shopper when reliable data supports the match. One order should not increase the store’s total result twice.
- Compare completed groups. Give orders from both channels the same time for payment, receipt, and returns to be accounted for. Do not compare new leads from one channel with final results from the other.
- Account for sales conditions. Compare the same time periods, categories, availability, prices, and promotions. Note holidays, seasonal changes, and operational disruptions that may have affected demand or service.
- Put money alongside percentages. Along with the number of shoppers, show acquisition costs, returns, and contribution after variable costs.
If some purchases cannot be reliably linked to a channel, leave them in a “source unknown” category. Do not assign them arbitrarily just to fill out the table. Even when the same rules are used, a higher conversion rate in one channel shows an observed association; by itself, it does not prove that the channel caused the difference.
Test one specific change
Suppose the inquiry log shows that shoppers often ask about the full delivery cost and do not confirm an order after receiving the answer. A practical hypothesis is that if the salesperson gives the total for the goods and delivery right away, more people will be able to decide without extra messages. To test this, change only this part of the first response.
- Define participants. Include new inquiries about one product category with the same delivery terms. Count each person in only one group.
- Assign inquiries at random. One group gets the current response; the other gets a response that gives the full total at the start of the conversation. Run the test at the same time so day-of-week and seasonal effects have less influence on the comparison.
- Record the measures in advance. The primary measure is the share of inquiries that result in confirmed orders. Also check payment and receipt, returns, contribution per inquiry, and salesperson time.
- Set the test limits. Before starting, set the duration and planned number of participants. If the store does not reach the planned number, record the limitation and do not call a chance difference a proven result.
Illustrative result. In the group that received the usual response, 30 of 75 people confirmed an order, or 40%. In the group that received the new response, 36 of 75 did, or 48%. The difference is 8 percentage points, or six additional confirmations in these groups.
With such a small sample, the difference may be due to chance, so this example does not prove the change is effective. Wait for the final order outcomes and check whether contribution fell because of delivery costs or returns. For a small store, a short test may also miss seasonal swings, rare high-value orders, or differences between salespeople.
How to analyze purchases and reconcile online orders in Torgsoft
In “Аналіз → Аналіз активності покупців” (“Analysis → Customer Activity Analysis”), you can select a period and accounting center, filter customers by number of purchases, and view the number of receipts, sales amounts, date of the last purchase, and amount of the last receipt. A practical use is to identify repeat customers and check their activity over the same periods. According to the official help documentation, the “Виручка реалізацій” (“Sales Revenue”) figure does not account for returns, so you need to reconcile it with store records to assess results after returns.
This analysis covers purchases and customer records saved in the program, so add website visit data or inquiry log entries for the funnel’s earlier stages. The help documentation also describes manually creating a contact and a reminder that appears when the program launches on a specified day.
If the store is setting up an exchange with a website, the official synchronization instructions cover finding customers by phone number and setting up payments, accounting centers, and the exchange schedule. Ask the website developer to configure the data exchange format according to Torgsoft’s official instructions. Automatic exchange runs only when the program is open on the designated computer under the specified user, and the interval must not be shorter than 10 minutes. After setup, reconcile a test order and the synchronization log: importing an order by itself does not confirm payment, receipt, or the final outcome after returns.
Collect only the personal data needed for analytics
For a store in Ukraine, the applicable law is the Law of Ukraine “On Personal Data Protection” dated 01.06.2010 No. 2297-VI. Article 6 requires a defined lawful purpose for processing, relevant and non-excessive data, and storage in identifiable form for no longer than necessary for lawful purposes. Article 11 provides for different grounds for processing, including consent, entering into and performing a transaction, and pre-contractual steps at the person’s request.
In practice, the owner should separately define which data is needed to fulfill an order, which is needed for analytics, and which is needed for marketing messages. Do not automatically move contact details collected for delivery into an advertising list without determining the appropriate legal basis. Under Article 6, a new purpose incompatible with the original purpose requires the person’s consent unless the law provides otherwise.
For a weekly report, use aggregate numbers and internal codes instead of unmasked phone numbers and addresses. Give access to contact details only to employees who need them for work, and set a retention period that accounts for the store’s purpose and legal obligations. A participant code does not make data anonymous if the store can link it to a specific person.
Set up a short weekly review
At the end of the week, the responsible employee checks for duplicates, incomplete orders, and new returns, then updates the figures for groups that have had enough time to be observed. The owner reviews transitions, the absolute number of incomplete purchases, and contribution after variable costs. For each noticeable change, they add known circumstances: unavailable stock, a promotion, a delayed response, or a change in delivery costs.
Based on this review, choose one action, assign an owner, and define the measure you will use to assess it. Next time, check whether the action was completed and whether there is enough data to draw a conclusion. This gives the store a consistent record of decisions and results to rely on when making further changes.


 Go back to the previous step